Impact of employee churn or turnover
Depending on the type of business churn can be a severe problem that needs to be addressed. Even if the time and cost of investment (recruitment, hiring, training) are considered relatively low for a given workforce, it will always be non-zero. Additionally, we are all too aware of the impact on team morale and company image.
Once a company gets to a certain size the process of onboarding and offboarding can become like painting the Golden Gate bridge and if you neglect to repaint the bridge, rust and spider webs quickly overwhelm it and could bring it down (well, maybe not the spider webs). For example, it is clear that if you have a severe turnover problem without ample replacement (net headcount is down) you suffer from exponential decay of your workforce (assuming a constant loss rate year on year). To illustrate this point, in an extreme case with 20% year on year loss of your workforce, the half-life of your company is just 3.1 years! Whilst this may be an exaggeration in real cases, 20% of your workforce leaving every year is a reality we see with some companies (but here inward rates keep the total net rate ≥ 0).
We will never live in a world with a 100% efficient and productive workforce (as long as humans are doing the work) and people will always leave a company at some point, but we can aspire to get closer to 100% by constantly looking at ways of reducing turnover and absenteeism. “Machine learning will save us!” I hear you cry. Well, yes, we can do some clever things with ML and indeed it can help to tackle some of these issues – and indeed we have done this. However, there are some other more traditional, or old-school if you will, methods left behind in the hullabaloo of AI, which is actually pretty useful when it comes to understanding churn and offering crucial insights into the why. I am indeed talking about survival analysis.
What is Survival Analysis?
As is in the name, survival analysis is focused on surviving – the probability of surviving until a given time.
It is prevalent in medicine and is considered the gold standard for many medical trials. For example, it can be used to understand and model: the efficacy of a drug for a disease; survival rates for different groups following heart surgery; time from one heart attack to another. It is also widely applicable to areas outside of medicine. Financial companies use it for credit risk assessment, in criminal justice they use it to identify predictors of criminal recidivism, and in marketing survival analysis is used to understand customer retention.
Survival Analysis to understand employee churn
Looking at Survival Analysis in HR, let’s start with a question:
Are employees who drive to work more likely to leave compared to people who cycle?
Answering burning questions like the one above, testing hypotheses, and comparing certain demographics of people, is really where this type of analysis excels. It’s all very good to make good predictions, but the real power is in the why – why do people leave our lovely company? We have fruit baskets and standing desks! Should we introduce a cycle to work scheme? Should we allow employees to work remotely? Whilst I doubt fruit baskets are enough to tempt employees to stay, if you have the right data about employees and their attrition then indeed certain hypotheses can be tested and help to answer some key questions about churn. (Of course, the only way to confirm it is through experiment!).
As I said before, survival analysis is the probability of surviving until a given time. Whether that is: the time until death after contracting a disease; the time until recovery given a certain treatment; the time between one instance of absence to the next; the time until leaving a company. All of these can be thought of as the time until an event. Commonly in literature, the event itself is referred to as “death”, specifically in medicine, but in no way does it have to mean death in the mortal sense. To turn it on its head, the death event can even represent birth in the case of gestation times.
The Survival Function
Let us denote the survival function, S, as the probability, P, that the time until death (or event), T, is after some point time, t, formally:
S(t) =P(T >t)
The survival function therefore cannot exceed 1, it cannot be negative at any point in time (negative probabilities don’t make sense) and it does not increase with time. Therefore, the probability of death can only get worse (or stay the same) with time. After that rather bleak outlook let’s see an example of what a survival function looks like in practice – see the figure below.
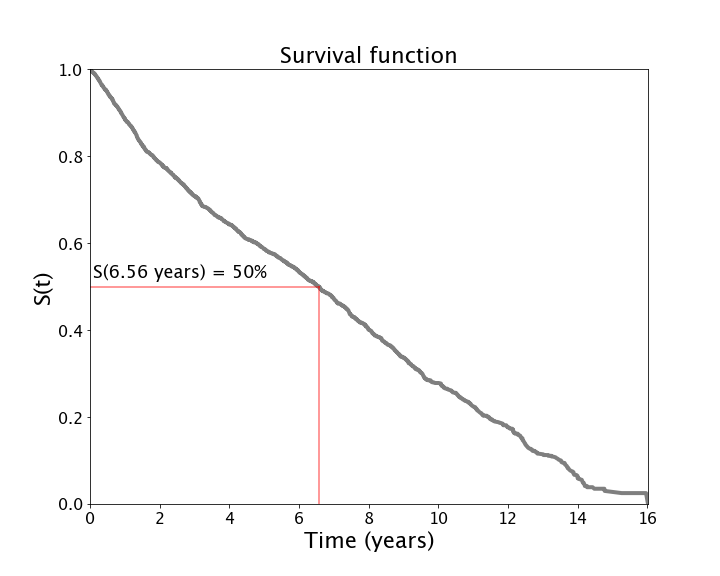
Notice in the example above, it starts at 1 and tends to 0 but actually never hits 0, meaning that there is still a slim chance of surviving past 16 years (in this example that means time to attrition). In this example, we can see that median tenure is just over 6.5 years. Put another way, workers have a 50% chance of leaving within the first 6.5 years, which is not a bad tenure.
If we now want to examine survival functions for different demographics that is quite simple and easy to do. We can compute our survival function for each group and then compare them. To illustrate how this works I have engineered the dataset to label people based on a uniformly distributed random number and one with some biases towards different transport methods. Try and figure out which one is which (hint: the left one is random).
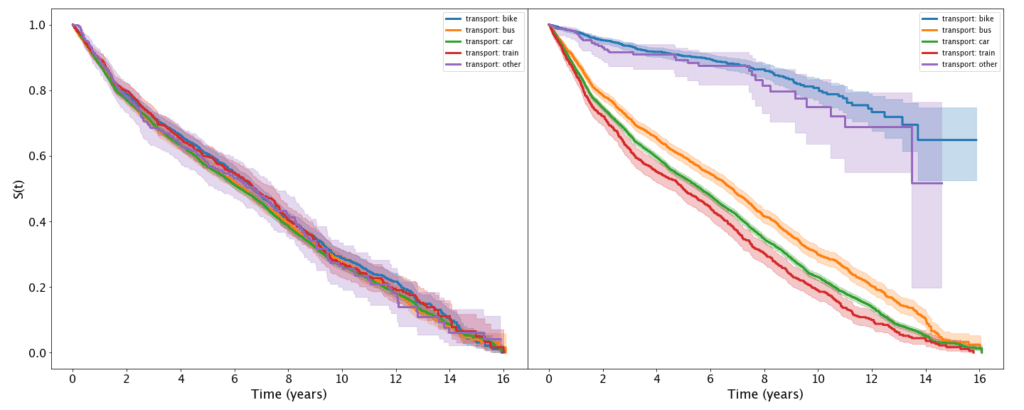
From this experiment, we can see that by randomly assigning people for the churn there is no noticeable difference between people based on their transport preferences (the left plot). Whereas on the right, we can see a huge difference between the groups with cyclists (blue) and other transport methods (walkers, etc) (purple) much more likely to survive – that is to stay in the company. We can see that if you commute to work via train (red) you are at most risk for leaving. In this case, I generated the labels (“leaver” = 1, “stayer=0”) based on the following probabilities: bike at 5%, other at 5%, bus at 30%, car at 40%, and train at 50%. We can also see a clear difference between cyclists (blue) and car drivers (green). While the probability of cyclists to stay after 16 years is around 80%, for those who come by car this is close to zero.
So, we can answer our previous question based on this dataset – people who drive to work are indeed more likely to leave earlier when compared to cyclists.
Correlation versus causation
By examining and comparing survival functions for different populations we can start to gain insights into the drivers of churn. But remember correlation is not causation! Ideally, we would need to confirm these findings through a set of experiments. However, we can already use this information to act on the insights and can help motivate change at the workplace.
For example, if you know employees who drive to work are much more likely to leave earlier compared to cyclists, what could be causing this? You could set up a campaign to advertise coming to work by bike and promote a discount scheme, for example. Of course, cycling to work is simply not possible for some commuters, and in that case, promoting working from home, or flexible working to reduce commute times, are possible approaches.
The key here is to use your data to get actionable insights on your workforce and then to act on those insights and repeat. Test, learn, experiment, and improve.
That concludes part 1 of the series on survival analysis. In the next part, I will aim to go deeper into the methods and focus on censoring. So stay tuned!